Contents
Previous
Next
 Spider plots are most often used to display how a number of results
 compare to some set targets. They make good use of the human ability to
 spot symmetry (or rather un-symmetry) . the figure below show an
 example of a spider (sometimes called a web-plot). Spiderplots are not
 suitable if you want very accurate readings from the graph since, by
 it's nature, it can be difficult to read out very detailed values.
  Figure 110:
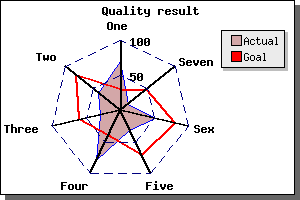
Figure 110: A typical radar graph with two plots 
[src] 
 
- There is one axis for each data point
- Each axis may have an arbitrary title which is automatically
 positioned
- A spider plot may be filled or open
- You can control color, weight of lines as you are already used to
- A spider plot can, as usual, have a title and a legend
- The first axis is always oriented vertical and is the only axis with
 labels
- Grids may be used (dashed in the figure above)
- You may have ticks (although suppressed in the figure above
- You can control the size and position within the frame of the graph
- You may have several plots within the same graph
 In the following section we show how to draw both simple and complex
 radar graph. As we will show all the settings will follow the same
 pattern as for the more standard linear graphs.
Contents
Previous
Next