Location
Point
x, y coordinates of the center point of the plot area bounded by the frame.
PlotAreaWidth
Numeric
Width of the plot area.
PlotAreaHeight
Height of the plot area.
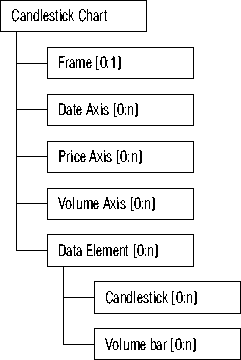
When you set properties for Candlestick Chart objects with the Object Inspector, you can also specify properties for Frame, Date Axis, Price Axis, Volume Axis, Data Element, Candlestick, and Volume Bar objects. The association between a Candlestick Chart object and supporting objects is represented in Figure A-1.
Figure A-1 Candlestick Chart Objects
The Candlestick Chart object has the following child objects.
Frame
See "Frame".
Date Axis
See "Axis (Date/Time and Numerical)".
Price Axis
Volume Axis
Data Element
See "Data Element".
Candlestick Bar
See "Candlestick".
Volume Bar
See "Vertical Value Bar".