Contents
Previous
Next
It can often come in handy to have horizontal bar graphs especially
if you have a large number of values to display. Even though JpGraph
doesn't directly support horizontal bar graphs this is easy achieved by
constructing a normal vertical bar graph which is then rotated 90
degrees.
The example below shows a simple example of this
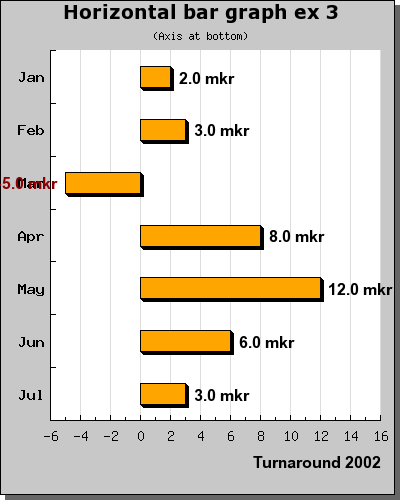 Figure 40:
 A typical horizontal bar graph with the Y-axis at
the bottom
[src]
In order to achieve this effect you should study the above example
carefully and you might notice two things
- We don't simply rotate the graph we also specify that we want the
rotation center to be the middle of the entire image. The reason for
this is that by default (See the section on rotating plots) the pivot
point for rotation is the center of the plot area.
Since the center of the plot area is not necessary the center of the
entire image the rotation might be a little bit difficult to predict
since it will depend on the margins specified. <
- The size of the plot area is determined from the original width and
height of the image taking the specified margin into account. When the
the plot area is rotated 90 degrees clockwise what was the left margin
now in effect become the upper margin and so on. This is a small nuance
since we conceptually want to specify the margins directly in the
rotated plot.
In order to more easily handle the margin with rotated images it is
recommended that the method "Set90AndMargin()" is used. This allows the
image to be rotated as well as specifying the margins in an obvious
way.
We finally show three more examples of horizontal bar plots. In the
first plot we have hidden the Y-axis and in the second we have
positioned the Y - axis at top as opposed to the bottom as the first
example shows.
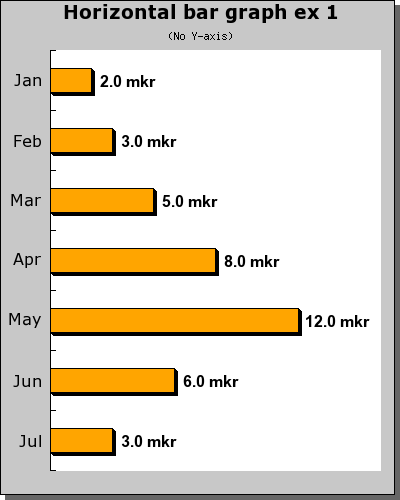 Figure 41:
 Horizontal bar graph with hidden Y axis
[src]
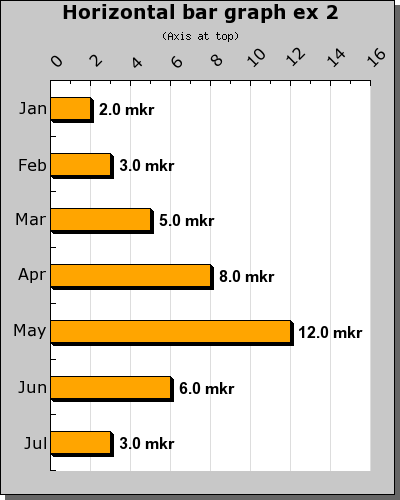 Figure 42:
 Horizontal bar graph with Y axis at the top
[src]
In the final example which is almost similar to the two first we
illustrate the use of labels with more than one line.
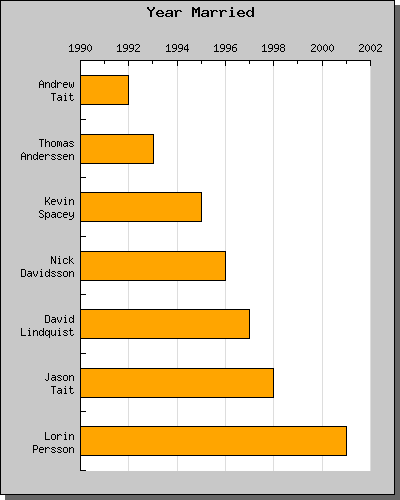 Figure 43:
 Horizontal bar graph with manual integer scale as
well as multiple line labels
[src]
Contents
Previous
Next