Contents
Previous
Next
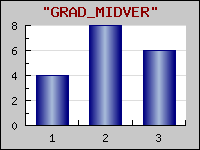
It is possible to use color gradient fill for the individual bars in
the bar graph.
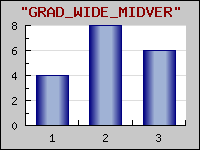
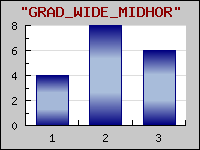
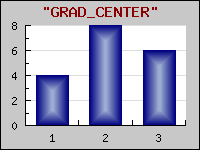
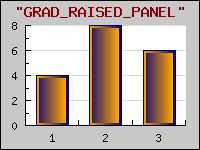
Color gradient fill fills a rectangle with a smooth transition
between two colors. In what direction the transition goes (from left to
right, down and up, from the middle and out etc) is determined by the
style of the gradient fill. JpGraph currently supports 8 different
styles. All supported styles are displayed in the figure below.
To specify a gradient fill for the bar plots you make use of the
method
BarPlot::SetFillGradient() . See the class reference for details of
this function.
When using gradient fills there are a couple of caveats you should
be aware of:
- gradient filling is computational expensive. Large plots with
gradient fill will take in the order of 6 times longer to fill then for
a normal one-color fill. This might to some extent be helped by making
use of the cache feature of JpGraph so that the graph is only generated
a few times.
- gradient filling will make use of much more colors (by definition)
this will make the color palette for the image bigger and hence make
the overall image larger. It might also have some severe effect on
using anti-aliased line in the same image as color gradient filling
since anti-aliased lines also have the possibility to make use of many
colors. Hence the color palette might not be big enough for all the
colors you need. So if you use gradient fills you should also be using
a true-color image since you otherwise run out of colors.
This problem is often seen as that for no apparent reason some
color you have specified in the image does appear as another color.
(This is not a bug in JpGraph!) This is something to especially watch
out for when enabling anti-aliasing since that also uses a lot of
colors. Since the numbers of colors used with anti-aliasing depends on
the angle on the lines it is impossible to foresee the number of colors
used for this.
Contents
Previous
Next